GTKMathplot
Table of Contents
2 ABOUT
GTKMathplot is an interactive plotting program for GNU/Linux, Unix(R) and Windows(R) based on GTK+, a multi-platform toolkit for creating graphical user interfaces, and on the Cairo graphics library. GTKMathplot requires at least version 2.18.0 of GTK+ and version 1.6.0 of Cairo to be successfully built and run.
With GTKMathplot you can display and eventually save to a file the graphics of bidimensional curves, tridimensional curves and surfaces. To accomplish this you have to specify the cartesian or parametric equations describing the mathematical objects you would like to visualize.
GTKMathplot has been made in such a way that the basic usage of the program should be intuitive for every high school student with good mathematical knowledge. University students of Engineering, Physics, Mathematics or natural Sciences should need no explanation at all to start using GTKMathplot proficiently. From this point of view, GTKMathplot differs from popular plotting programs like GNUplot: also people proficient in Mathematics need to read a user manual before they can start working with GNUplot.
However, GTKMathplot is not so powerful as GNUplot and friends; in particular, GTKMathplot does not provide a scripting language to work with it in a non-interactive way, nor supports contour plots. Despite of this, GTKMathplot provides already 90% of the basic GNUplot features. Some features that I would like to add in the near future are:
- Visualization of two- and maybe three-dimensional vector fields,
- Support of user-defined constants in the cartesian / parametric equations,
- Contour plots of three-dimensional surfaces and data.
In case you would like to know how GTKMathplot looks like, here are some screenshots, which show the input mask and the output page of the program.
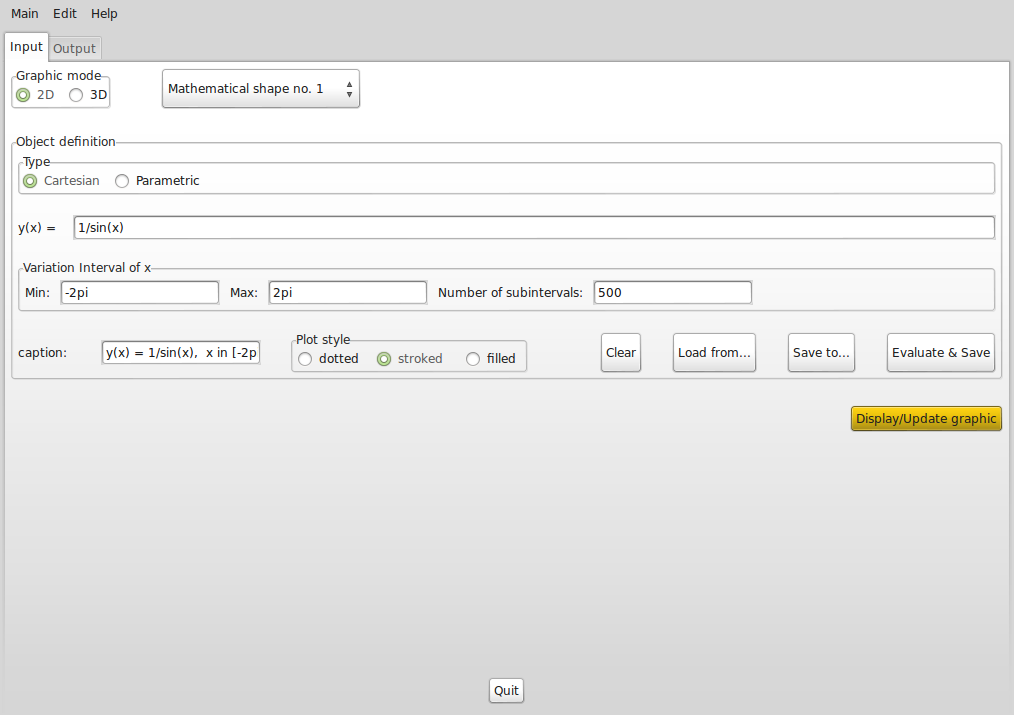
The input mask of GTKMathplot in two-dimensional graphic mode
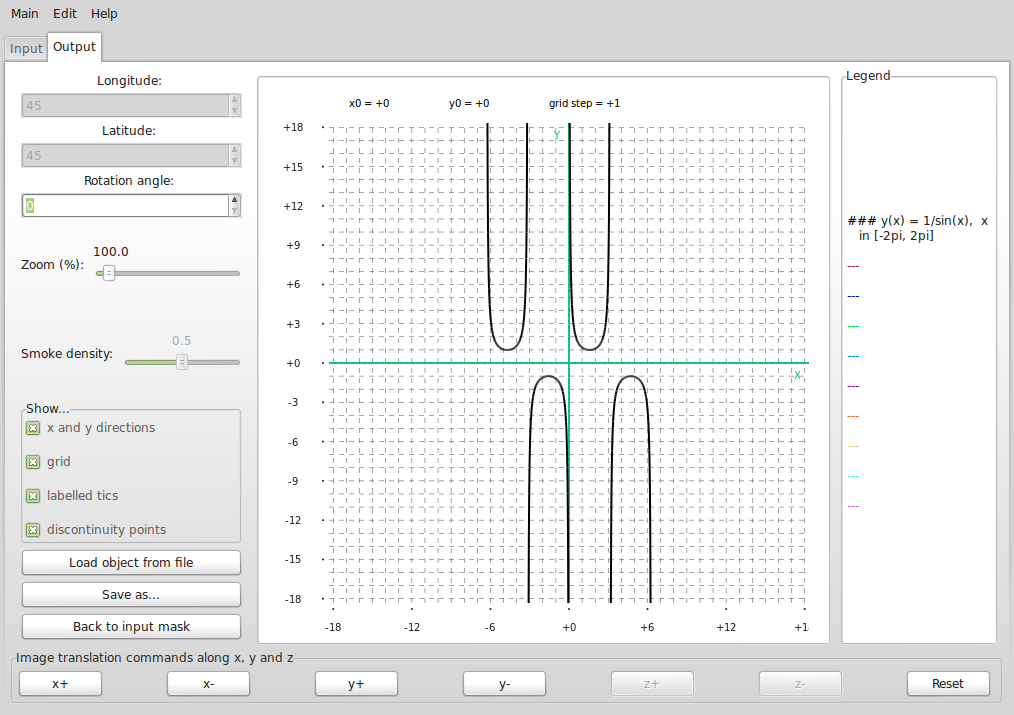
The output page of GTKMathplot in two-dimensional graphic mode
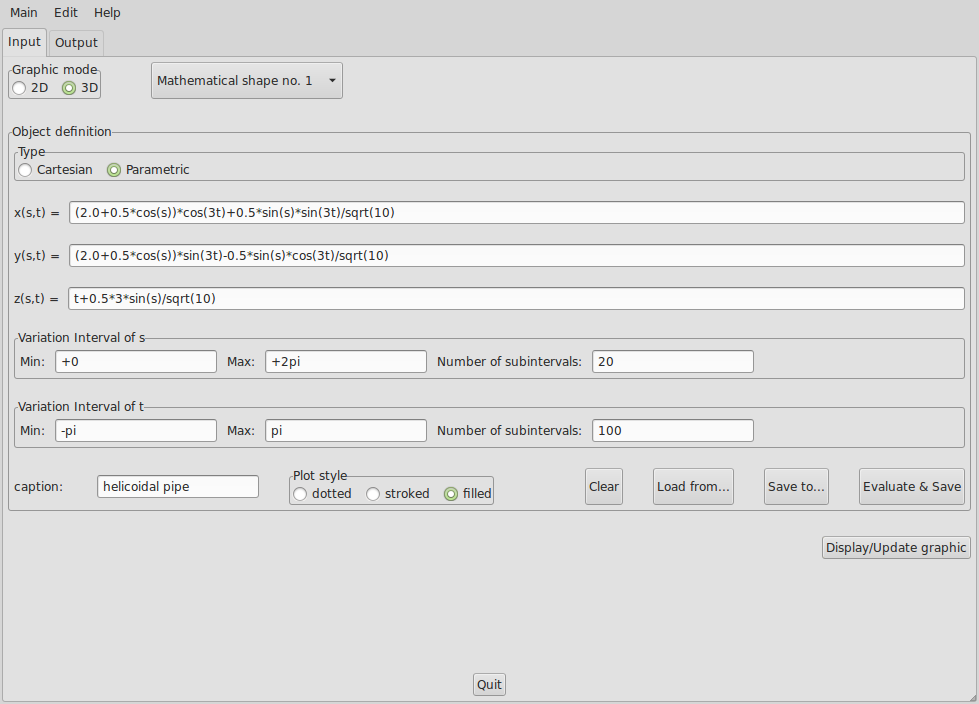
The input mask of GTKMathplot in three-dimensional graphic mode
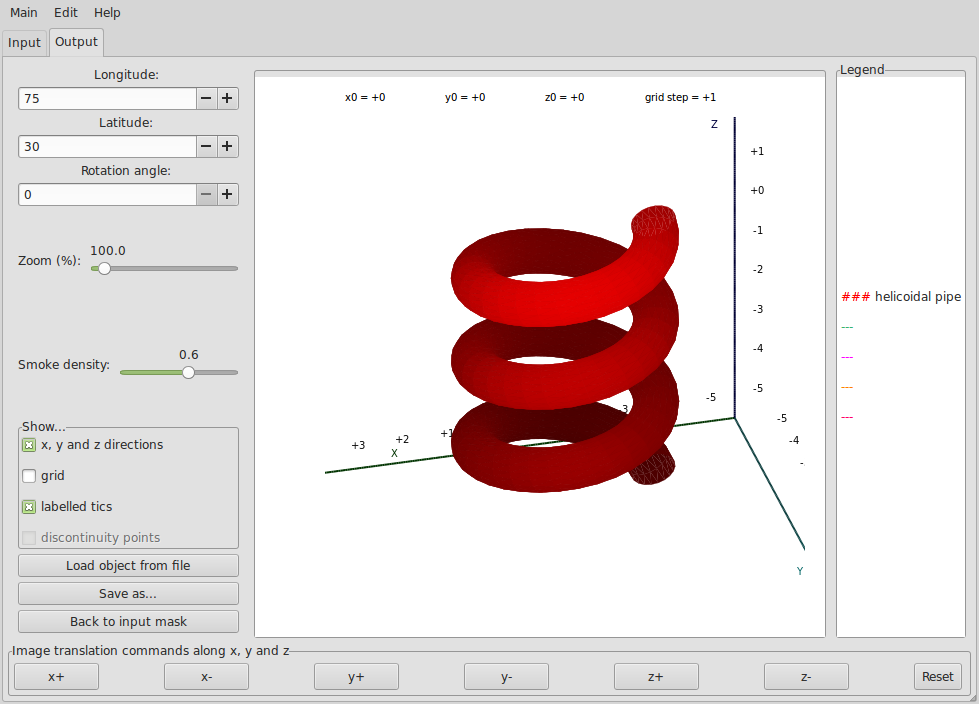
The output page of GTKMathplot in three-dimensional graphic mode
3 LICENSE AND DOWNLOAD
GTKMathplot is distributed under the terms of the GNU General Public License as published by the Free Software Foundation; either version 3 of the License, or (at your option) any later version. GTKMathplot is distributed in the hope that it will be useful, but WITHOUT ANY WARRANTY; without even the implied warranty of MERCHANTABILITY or FITNESS FOR A PARTICULAR PURPOSE. See the GNU General Public License for more details. You should have received a copy of the GNU General Public License along with the program. If not, see http://www.gnu.org/licenses/.
The tar-gzipped archive with the source code of GTKMathplot can be downloaded from
http://savannah.nongnu.org/download/gtkmathplot
The latest stable release of GTKMathplot is given by the version 1.0.0. GTKMathplot comes with a very extensive online help (in English), which you can also browse online here.
If you would like to contribute to the development of GTKMathplot, you are free to do it as long as you comply with the conditions stated in the GNU General Public License. Mind that GTKMathplot is "free software", in the sense explained at http://www.gnu.org/philosophy/free-sw.html. I decided to release it under GNU General Public License since I want that it remains free software.
4 INSTALLATION
To successfully compile, build and install GTKMathplot some tools and libraries are required. The first required tool is an ANSI C compiler conforming to C89 (compliance to C89 is nowadays a standard feature of every C compiler). The compiler should accept at least the option `-o' to write its output to a specified file, the option `-D' for macros pre-definition, the option `-l' to search for a specified library, and the options `-I' and `-L' to add a given directory to the search path for include and library files respectively. GTKMathplot has been successfully compiled and tested on GNU/Linux Mint 14.0 with the version 4.7.2 of the GNU C Compiler (gcc), and on Windoze 7 with MinGW-20120426/gcc-4.6.2.
In addition, you need the GNU implementation of the `make' utility, also known as `gmake', and a POSIX implementation of the commands `rm' and `rmdir'.
Finally, since GTKMathplot is based on GTK+ and on the Cairo graphics library, these libraries should be both installed on your system before GTKMathplot can be compiled and built. GTKMathplot requires at least
- version 1.6.0 of Cairo and
- version 2.18.0 of GTK+, or any version of GTK+ from 3.0 on.
GTK+ and Cairo are nowadays integral part of every GNU/Linux system. However, not all GNU/Linux distributions install by default also the development files of these libraries. Since these files are required to compile GTKMathplot, you should make sure that they are actually installed before trying to build GTKMathplot (otherwise, the building process will fail). You can download and install the software packages with Cairo and GTK+ development files by using the package manager of your GNU/Linux distribution. On Debian GNU/Linux and its derivatives (like Ubuntu and Mint), this can be accomplished by issuing the following commands in a terminal window:
- sudo apt-get install libcairo2-dev
- sudo apt-get install libgtk2.0-dev
In alternative, you can use synaptic or the software manager of your distribution. Be prepared that the first of these commands could require that you enter the password of a privileged user (the root/administrator password or your user password, depending on how you configured your system) to start the installation. If you prefer to build GTKMathplot using the version 3.x of GTK+ (which I will call GTK+3 for brevity) instead of version 2.x (GTK+2), then you should install the development files of GTK+3 together with/in alternative to the ones of GTK+2:
- sudo apt-get install libgtk-3-dev
Configuration, building and installation of GTKMathplot can be performed from the directory with the source files of the program either through:
make install
or through:
make -f makefile.gtk3 install
if you prefer to compile GTKMathplot against GTK+3 instead of GTK+2.
Of course, I assume here that you know:
- how to unpack the tar.gz archive with the source code of GTKMathplot,
- how to open a terminal window, and
- how to issue in the terminal the command to move to the directory with the source files of the program.
Only after performing these operations you can enter one of the build (make) commands above.
By default, `make install' will install all the files in `/usr/local/bin' and `/usr/local/doc/gtkmathplot'. You can specify an installation prefix other than `/usr/local' by changing the definition of PREFIX in `makefile' or `makefile.gtk3' before launching the build command. For better control, you can change the definition of BINDIR, but this is not advisable.
If later you want to remove GTKMathplot, you can do it by issuing a simple `make uninstall'.
Remark: The makefiles provided with GTKMathplot use by default gcc as compiler. You can choose another compiler by redefining the CC variable at the beginning of the makefile.
5 CONTACT
For questions and issues related to GTKMathplot you can contact me per email by writing to <ivprimi (at) libero (dot) it>. Please, put GTKMathplot in the subject and indicate:
- which operating system you are running,
- the compiler used to build GTKMathplot (please specify also the version),
- the version of GTK+ and Cairo which GTKMathplot has been built with.
Before writing an email be sure to run the latest stable version of GTKMathplot, I do not provide support for older versions.
6 ACKNOWLEDGMENTS
I want to thank all the people till now involved in the Free Software community, starting from those ones directly involved in the GNU project (http://www.gnu.org). Without their great work, this little one would have never been done.


Date: 2013-05-26 20:19:20 CEST
HTML generated by org-mode 6.33x in emacs 23